Getting Started
After the basic setup has been installed according to Basic Getting Started, the Collector App can be set up and the Collector can be configured.
Include Collector(s).
In order for the Collector App to configure data collectors, it needs their network endpoint.
1. Go to the Data Collectors page via the navigation bar: http://localhost:4000/collector-app/de/collectors.
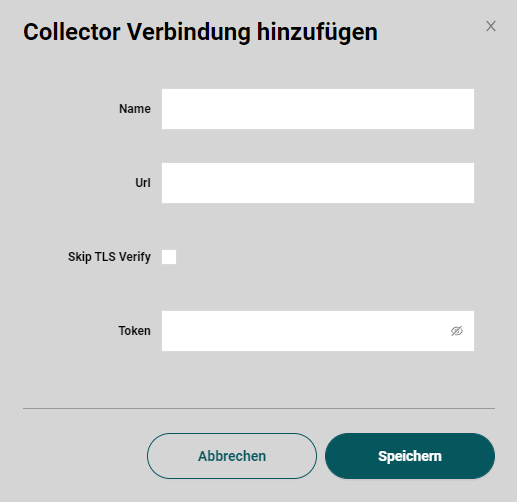
2. Click on the Add Collector button.
3. Any name can be assigned. The url starts with http:// for an unencrypted connection and with https:// for one encrypted with TLS, followed by the IP address/hostname and the port (default: http://localhost:8001). If an encrypted connection with self-signed certificates is used, TLS verification must be turned off. The Data Collector configuration interface can be secured with a token.
By default, no token is configured.
| Name | Url |
|---|---|
| Collector | Docker: http://collector:8001 Windows: http://localhost:8001 |
4. Click on Save. The collector appears in the collector overview table.
Collector settings
1. By clicking on the gear icon in the action column of the overview table of a collector column, the collector settings open.
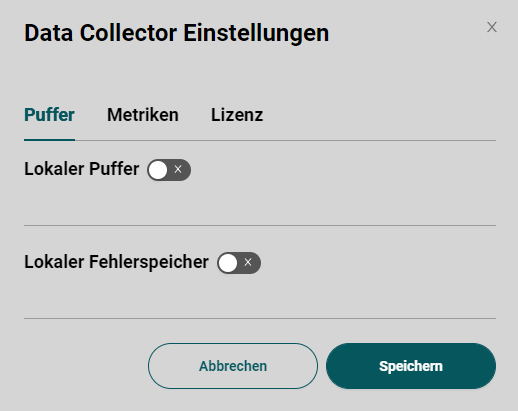
2. The buffer setting allows to store data locally on the computer on which the collector is running in case of a network interruption. A file path and the maximum buffer size must be specified. The local error memory stores information when data could not be transferred correctly.
3. By the Metrics setting the collector writes cyclic information about its own state into an Influx database.
4. If the license server is not found automatically by the broadcast search, its IP or hostname can be configured. In addition, the license mode in which the collector is to be operated is specified here.
Include OPC UA Browser
To be able to search OPC UA servers, an OPC UA browser is required. The Collector App also needs the network endpoint. The configuration is done equivalent to the Collector on the OPC UA Browser page.
| Name | Url |
|---|---|
| OPC UA Browser | Docker: http://opcua-browser:8080 Windows: http://localhost:8080 |
Create connections
The first thing to do is to configure the connection information to the data sources and sinks. This can be done on the connections page.
OPC UA Server connection
The OPC UA Server connection will be created as data source.
1. Click on the 'Create connection' button. A dialog with 3 steps opens.
2. A connection can be created on several collectors at the same time. For example if you want them all to write to a central database. Es werden also jene Collectoren im ersten Schritt ausgewählt.
3. Im zweiten Schritt werden allgemeine Verbindungsinformationen abgefragt. Die Ausfallzeitabschaltung gibt die Zeit an, die bei einem Verbindungsabbruch gewartet wird, bis ein erneuter Wiederaufbauversuch erfolgt.
The following values are configured for the quick start configuration:
Translated with www.DeepL.com/Translator (free version)
| Name | Url |
|---|---|
| Sample OPC UA Sample Server | Docker: opc.tcp://opcua-server:4840 Windows: opc.tcp://localhost:48010 |
The import function allows to load previously exported connections in form of a json file.
4. Finally the OPC UA connection type has to be selected. Then OPC UA specific security settings can be made. In the default case no security mechanisms are applied.
5. After clicking on Save the connection appears in the connection overview table.
Influx database connection
The connection to the Influx database serves as a data sink.
**The Create dialog is run a second time. This time with the following values for the demo setup:
| Name | Url | Database |
|---|---|---|
| InfluxDB | Docker: http://influxdb:8086 Windows: http://localhost:8086 |
demo-db |
The 3rd step is to select the Influx connection and configure the database name. If the database does not exist yet, it will be created automatically. The remaining parameters are set by default.
**After saving, the Influx database connection will also appear in the table.
Create symbols
Each link has subordinate symbols. There are output and input symbols, which are linked to each other. An input symbol can be linked to several output symbols. The following steps explain how to create an OPC UA Subscription symbol and link it to an Influx Measurement.
Create OPC UA Subscription
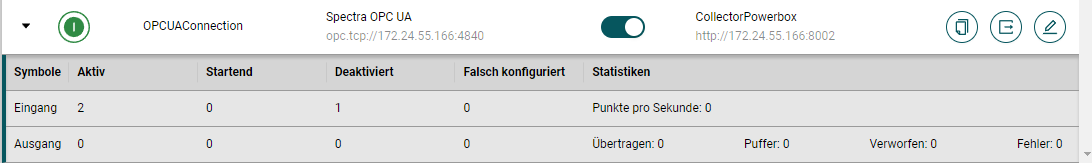
1. There are basically two different ways to get to the symbol overview: Via the navigation bar or if you click on the OPC UA connection in the connection table, the row will be expanded. A summary of the input and output symbols appears. By clicking on the input line you are automatically forwarded to the symbol page, so that the connection is directly pre-filtered.
2. On the symbol page the OPC UA Sample Server connection must be selected in the parent filter. To select from all connections click on the magnifying glass icon.
3. After a connection has been selected, the 'Create Symbol' button appears and can be clicked.
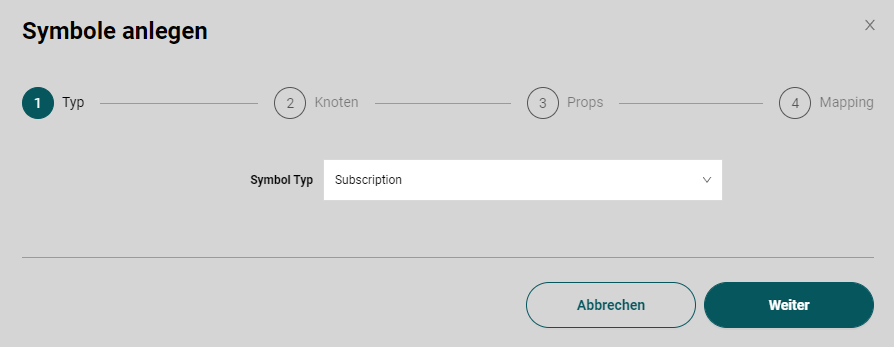
4. A dialog with several steps opens. As type the Subscription is selected.
5. In the next step the OPC UA Server can be searched with the help of the browser. By clicking on the checkbox OPC UA variables can be selected. At least one variable must be selected. For each selected variable an icon is created.
6. Afterwards optionally different properties can be configured.
7. In the last step 'Automapping' different connections can be selected, for each of which output symbols are created and automatically linked to the OPC UA Subscription symbols. Here the InfluxDB is selected.
8. After clicking Save, OPC UA Subscription and Influx Measurement symbols are created and linked automatically. If the symbols are switched on, the Data Collector starts working. The symbols appear in the table. By clicking on a symbol row the linked symbols are displayed.
Adjust Influx Measurement
1. Change the parent filter to the InfluxDB connection.
2. Expand an Influx Measurement in the table.
3. The structure of the measurement is displayed in the expanded area. Fields and tags can be configured here (Influx Doku). By default, the variable path in the OPC UA Tree is created as Tag and the value of the linked symbol as Value Field. The structure can be further customized here.
Grafana integration to visualization
Grafana is a web-based tool to visualize time series data. In the Collector App, a connection to Grafana can be created so that the data collected by the Collector can be displayed directly.
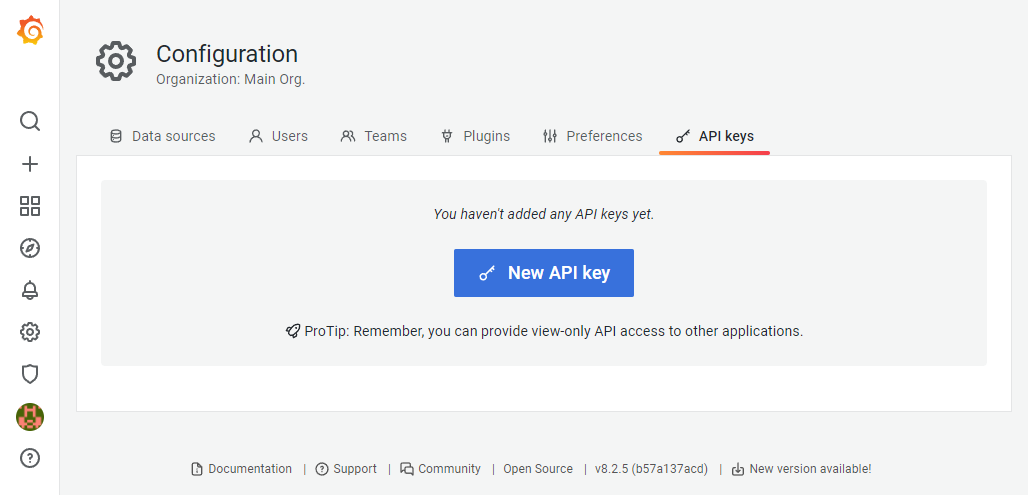
Create API Key
An API key can be created in the Grafana settings. This requires the admin role. More info in the Grafana doku.
Enter API Key
1. First select the settings page via the navigation bar.
2. In the 'Explore' module the Grafana integration is configured. Here the URL and the previously created API Key is entered. After clicking on Save you will be asked if Grafana Datasources should be created automatically based on the connections in the Collector App.
3. Now you can click on the link button in the symbol table for Influx Measurements. Then a new browser tab opens with a Grafana panel in which the measurement is displayed.